
Data Analyst · Kerala, India
Salahuddin K M
Data Analyst
I turn your raw data into meaningful insights that help you make better, faster decisions.
● Open to Work
Data Analyst
MIS Analyst
Business Analyst
Remote & Global
0
Projects Built
0
Years Experience
0
Tools Mastered
Salahuddin K M
Data Analyst
Data Analyst — turning raw data into clear decisions.
I work with Excel, MySQL, Power BI, Python, and Tableau to clean, analyze, and present data in ways that are genuinely useful to business teams.
2 years · Sales Operations · Zoya Business House, Oman — built KPI dashboards, revenue reports, and performance trackers used directly by senior management.
Skilled across the full analyst toolkit — from cleaning raw data in Python and SQL to presenting findings in Power BI and Excel dashboards.
B.E. graduate, Google Data Analytics certified, with hands-on experience in GCC business environments.
What I Work With
Core Competencies
📊
Excel
Power Query · Pivots
🗄️
MySQL
CTEs · Window Fns
🐍
Python
Pandas · Matplotlib
📈
Power BI
DAX · Dashboards
📉
Tableau
Story · Dashboard
🔢
Statistics
IQR · RFM · Regression
🧹
Data Cleaning
Null handling · Outliers
🤖
ML Basics
Regression · Sklearn
Analysis & Reporting
Pivot TablesKPI DashboardsData StorytellingVariance AnalysisTrend Analysis
SQL & Databases
JOINsSubqueriesCTEsWindow FunctionsDENSE_RANKAggregations
Python
PandasNumPyMatplotlibSeabornScikit-learnRFM Analysis
BI & Visualisation
Power BIDAXTableauExcel ChartsSlicersInteractive Reports
Where I've Worked
Work Experience
📍 Sultanate of Oman
Zoya Business House
Business Analyst — Sales Operations
Sep 2023 – May 2025 · Muscat, Oman
- Built weekly Excel reports tracking revenue, target attainment, and pipeline across regions and product lines — used directly by senior management
- Designed KPI dashboards with trend lines and variance analysis, reducing manual reporting time significantly
- Monitored conversion rates and monthly revenue trends, flagging anomalies and providing recommendations
- Identified data discrepancies in order records and implemented validation rules to improve accuracy
- Reconciled sales data across CRM and reporting systems, coordinating with cross-functional teams
What I've Built
Portfolio Projects
📊 Excel AdvancedBeginner
Hiring Process Analytics — HR Excel Dashboard
Analyzed 7,168 applicant records to uncover hiring patterns. Built an interactive Excel dashboard using Power Query ETL, IQR outlier detection, and connected slicers across 5 pivot analyses.
7,168
Applicants
9
Departments
65.5%
Hire Rate
6
Charts
Power Query
- →Position Tier column
- →Salary Band classification
- →Gender Group clubbing
Pivot Analysis
- →Gender × Hired/Rejected
- →Avg salary by dept
- →IQR outlier removal
Dashboard
- →4 KPI cards (live formulas)
- →6 charts in 3×2 grid
- →Gender & Dept slicers
Key Findings
65.5% hire rateOperations + Service = 67% of hiringClerical tier = 57% of positionsNo gender bias in selection

ExcelPower QueryPivot TablesQUARTILESlicers
View on GitHub →
🗄️ MySQLIntermediate
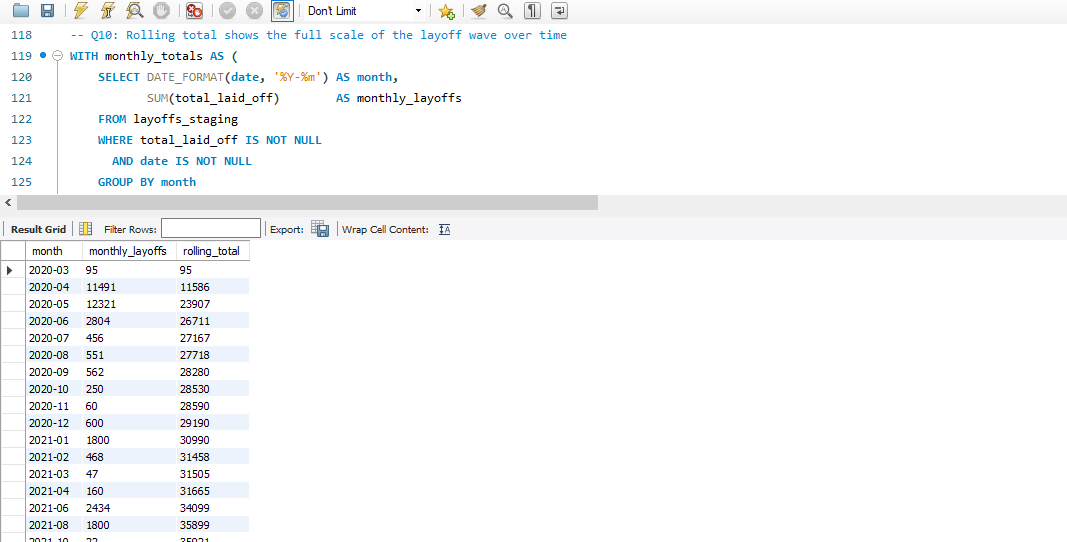
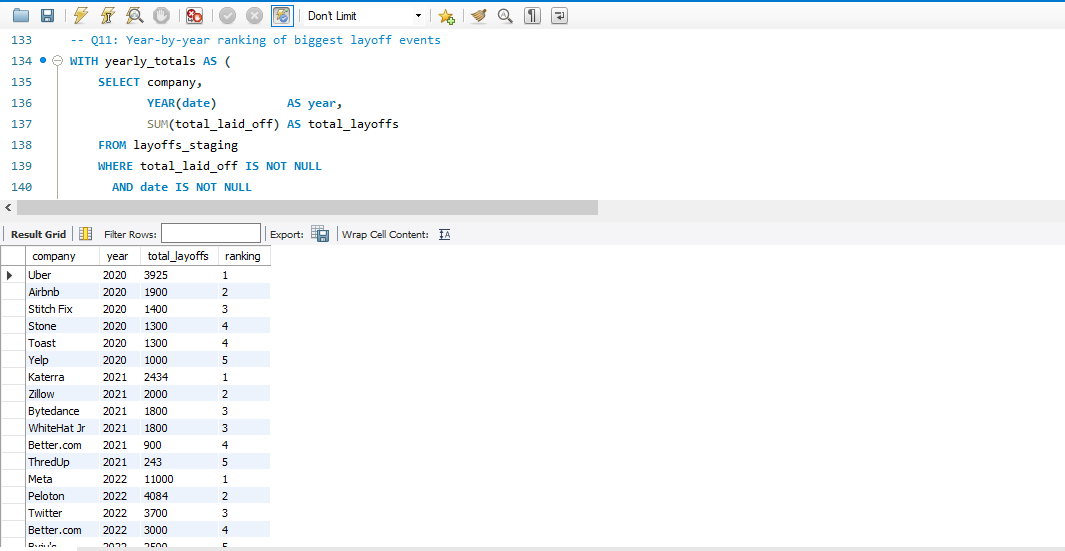
World Layoffs Analysis (2020–2026) — Pure SQL
Analyzed 874,980 layoffs across 4,342 events using 12 structured SQL queries. Cleaned entirely in SQL — from basic aggregations to CTEs with window functions and yearly rankings.
874K+
Layoffs
4,342
Events
12
SQL Queries
56+
Countries
Cleaning
- →TRIM & standardise
- →Fill nulls via JOIN
- →Remove null-only rows
Queries
- →GROUP BY aggregations
- →DATE_FORMAT trends
- →JOIN + subquery
Advanced SQL
- →CTE + SUM OVER (rolling)
- →DENSE_RANK + PARTITION
- →Industry benchmark JOIN
Key Findings
2023 worst year — 93,807 layoffsAmazon led at 58,124 totalUS = 70% of all layoffsPost-IPO = 62% of global total
MySQLCTEsWindow FunctionsDENSE_RANKJOINs
View on GitHub →
📊 Excel🗄️ MySQL📈 Power BIIntermediate+
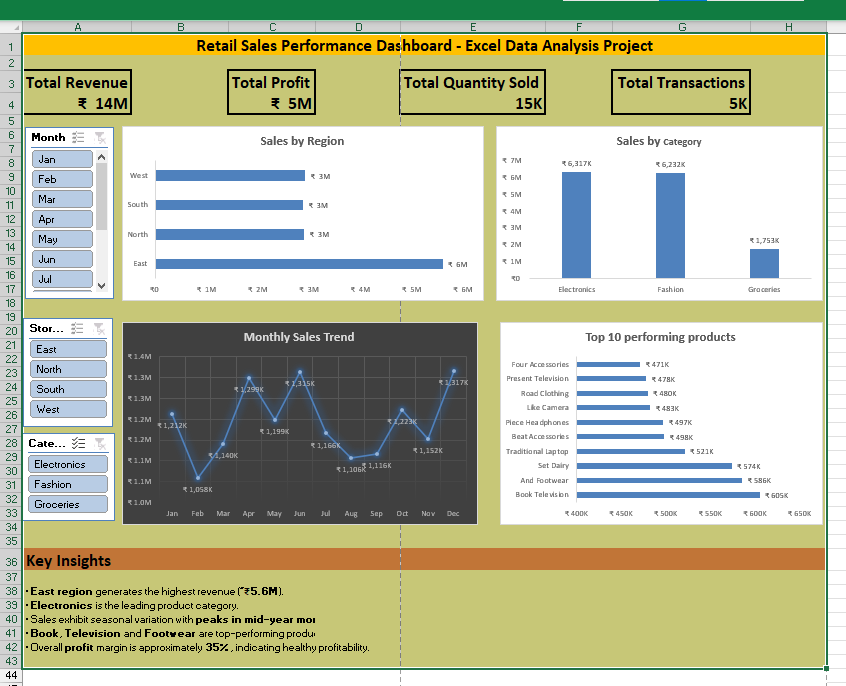
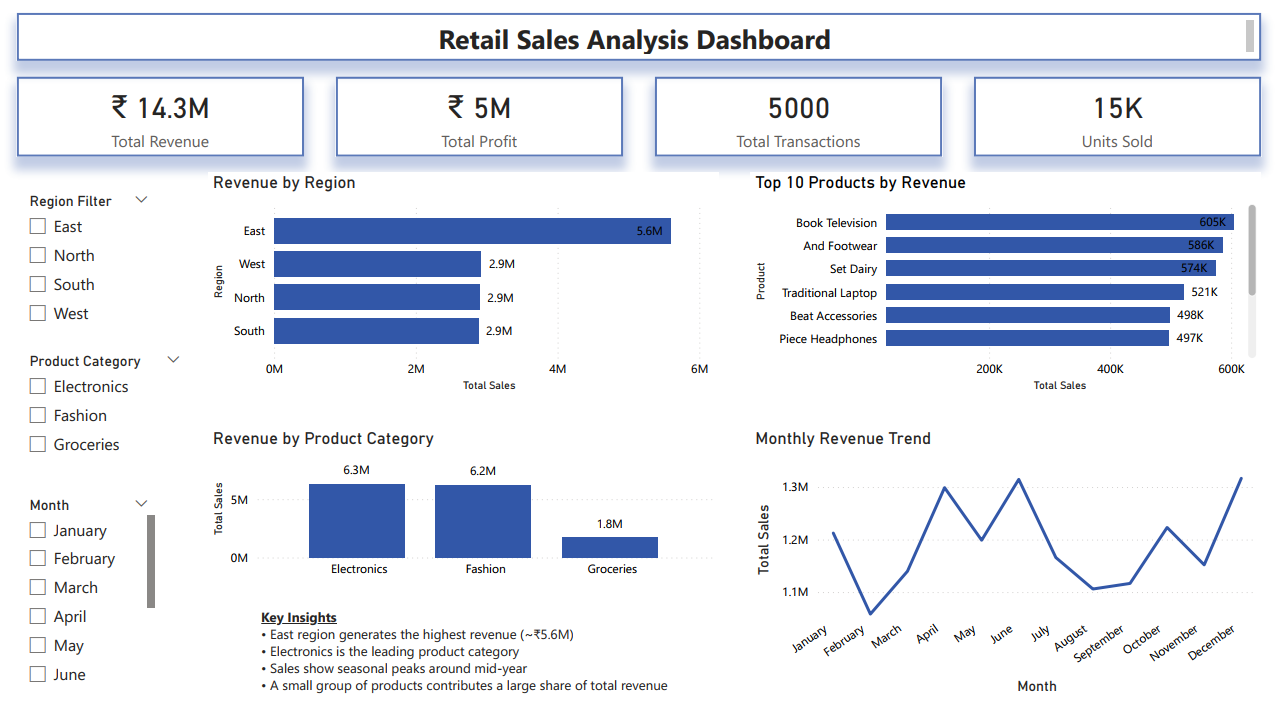
Retail Sales Analysis — End-to-End Multi-Tool Project
Complete retail analytics workflow across three tools — same dataset from raw data through SQL to an interactive Power BI dashboard. Mirrors real business analyst workflows.
5,000
Transactions
200
Customers
5
Regions
3
Tools
Excel
- →4-table master sheet
- →KPI cards & pivots
- →Interactive slicers
MySQL
- →Relational schema
- →Multi-table JOINs
- →Revenue & profit logic
Power BI
- →Top 10 by revenue
- →Monthly trend
- →Region & category slicers
Key Insights
East region leads (~₹5.6M)Electronics top categorySales peak mid-year confirmed
ExcelPower QueryMySQLPower BIDAX
View on GitHub →
🐍 PythonAdvanced
E-Commerce Sales Analysis — EDA & RFM Customer Segmentation
End-to-end Python analysis — data cleaning, EDA, KPI computation, and RFM customer segmentation identifying best, loyal, and at-risk customers with actionable retention strategies.
EDA
- →Null handling & filtering
- →Revenue & Month engineering
- →Monthly trends & charts
RFM
- →Recency, Frequency, Monetary
- →Best, Loyal, At Risk segments
- →Visualised with Seaborn
Key Insights
Strong Q4 revenue spikeUK dominates by revenueSignificant at-risk segment identified
PythonPandasMatplotlibSeabornRFM
View on GitHub →
🐍 Python🗄️ SQL🤖 MLMost Advanced
Olist E-Commerce — Customer Behavior & Revenue Forecasting
End-to-end analytics on 96,470 real Brazilian e-commerce orders across 7 joined tables. Answered 6 business questions using SQL inside Python — then built a Polynomial Regression model with Train R² = 0.92.
96,470
Orders
7
SQL Tables
6
Business Qs
7
Charts
0.92
Train R²
Cleaning
- →Null handling
- →Delivery calc
- →7 derived cols
SQL
- →6 business queries
- →7-table JOINs
- →Window functions
Visualisation
- →7 charts
- →Heatmap & trends
- →Business titles
ML Forecast
- →Poly Regression
- →Train/test split
- →3-month forecast
Key Findings
Revenue grew +705% Jan 2017→Aug 2018Fast delivery earns 4.41/5 vs 3.01 for slowPeak shopping: Mondays 4–5 PM
PythonPandasSQLiteMatplotlibSeabornScikit-learn
View on GitHub →
Academic Background
Education
🏛️
Bachelor of Engineering (B.E.)
Visvesvaraya Technological University
First Class · 7.4 / 10 CGPALearning & Credentials
Certifications
🎓
Google Data Analytics Professional Certificate
Google / Coursera · 8-course program
Feb 2026🏛️
☁️
💻
Value Proposition
What I Can Offer
📊
Dashboard Design
Build interactive KPI dashboards in Excel and Power BI — from raw data to a decision-ready visual in one workflow.
🗄️
SQL Data Analysis
Write clean, efficient SQL queries — GROUP BY, CTEs, window functions, JOINs — to extract business insights from large datasets.
🧹
Data Cleaning & Prep
Handle messy, incomplete data using Python (Pandas) or SQL — outlier removal, null handling, standardisation, feature engineering.
📈
Trend & Pattern Analysis
Identify revenue trends, seasonal patterns, and anomalies — and present them clearly to both technical and non-technical audiences.
👥
Customer Segmentation
Segment customers using RFM analysis — identify best buyers, at-risk customers, and build data-driven retention strategies.
📋
Reporting & Storytelling
Turn analysis into reports that decision-makers actually read — structured findings with clear recommendations and supporting visuals.
Built real dashboards used by management — weekly revenue reports and KPI trackers at Zoya Business House, Oman, tracked across regions and product lines.
Cleaned and validated business data — identified discrepancies in order records and implemented validation processes that improved reporting accuracy.
End-to-end project delivery — from raw CSV to cleaned dataset to analysis to dashboard, independently, across 5 portfolio projects.
Ready to contribute
Let's turn your data into decisions.
Open to Data Analyst, MIS Analyst, and Business Analyst roles — remote, hybrid, or on-site anywhere in India or the GCC.
✉ Let's ConnectGet In Touch
Open to opportunities.
If you're a recruiter or hiring manager looking for a data analyst, I respond to every message.
English · Fluent
Arabic · Fluent
Malayalam · Native
Hindi · Fluent
Kannada · Conversational
🌐 Multilingual — 5 Languages
English · Fluent
Arabic · Fluent
Malayalam · Native
Hindi · Fluent
Kannada · Conversational
🌐 Multilingual — 5 Languages